Tilapia species is the most widely grown of any farmed fish and the second most important group of fish in aquaculture after carps. Genetic selection has proven to be an essential contribution for a healthy and profitability tilapia industry. Tilapia breeds today far exceed the performance of their original wild ancestors.
GenoMar has the most long-standing commitment of professional and innovative breeding work to the tilapia industry. In 2021, we finalized the 30th generation of selection with genetic improvements to support a sustainable tilapia farming.
Broad selective breeding goals
GenoMar has been a pioneer to include various traits of commercial interest for selection in our breeding program of Nile tilapia. This genetic progress achieved by GenoMar mimics what has been seen in other terrestrial and aquatic species. This has been achieved by selecting and breeding individuals with superior characteristics every generation for the last three decades.
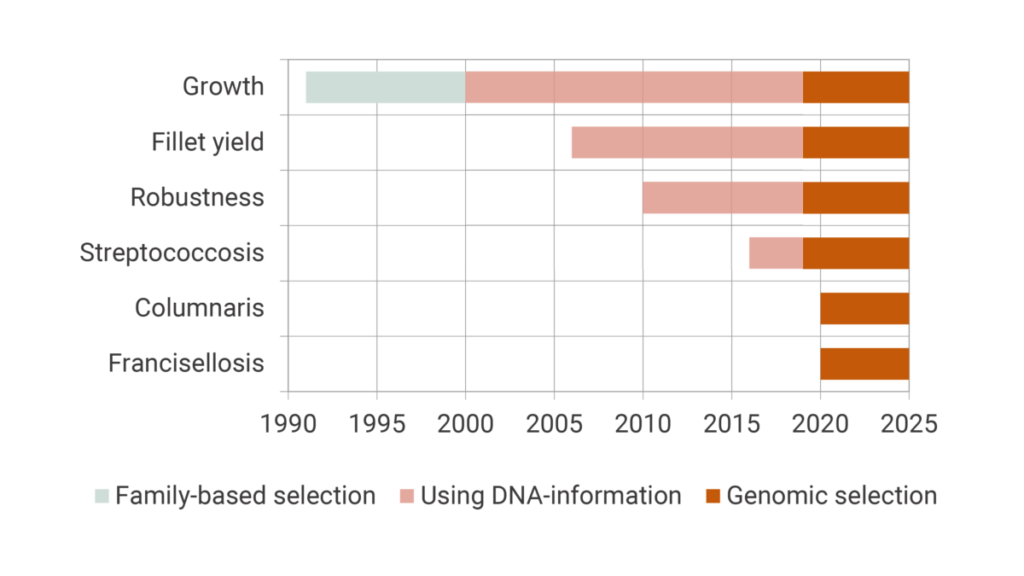
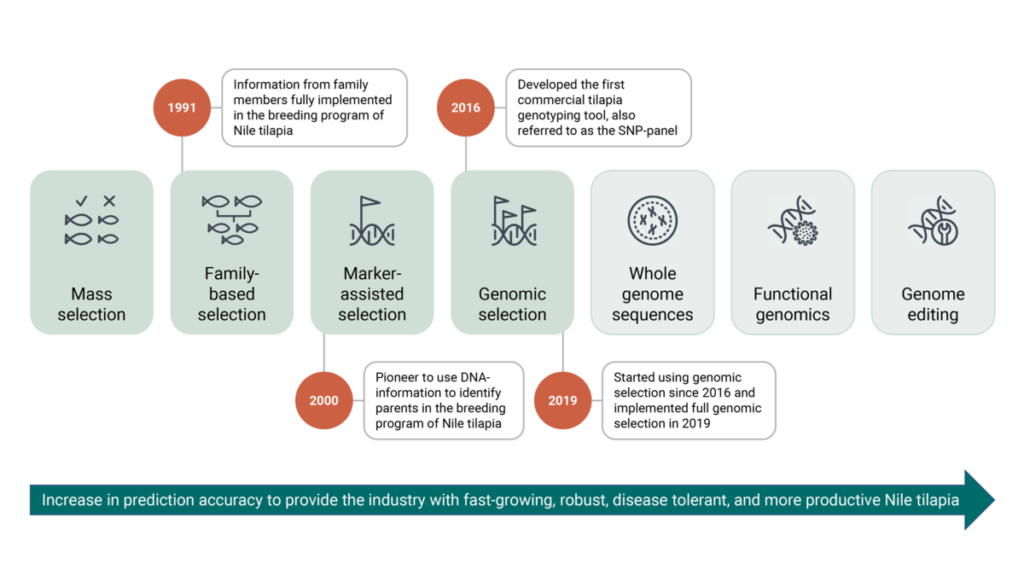
Production traits like growth, fillet yield and robustness including specific disease resistance have been improved during the last 30 generations of selections. Figure 1 shows the implementations of different traits in chronological order, together with the incorporation of novel breeding technologies used in our breeding stock.
Selected for growth in the first 16 generations
After the successful establishment of the breeding program of Nile tilapia in the late 1980s, the original purpose of the tilapia was to grow large quickly. Hence, during the first 16 generations in the GenoMar breeding program, fast growth was the number one trait and the only selection criteria. The combination of high heritability and strong weighing of traits has generated a solid fundament for the fastest growing tilapia strain in the industry.
Over the years, the market for tilapia has changed and the preference of farmers for other important commercial traits increased. Therefore, other traits like fillet yield, general robustness and specific disease resistance were successively introduced from generation 17 and onward.
Selected for several traits from generation 17
Development and introduction of new traits in the selection program open for a more balanced selection with more weight on traits targeting robustness/survivability and productivity. This development has taken place since 2006 and enables for a more differentiated product portfolio, with traits adapted to different farming conditions.
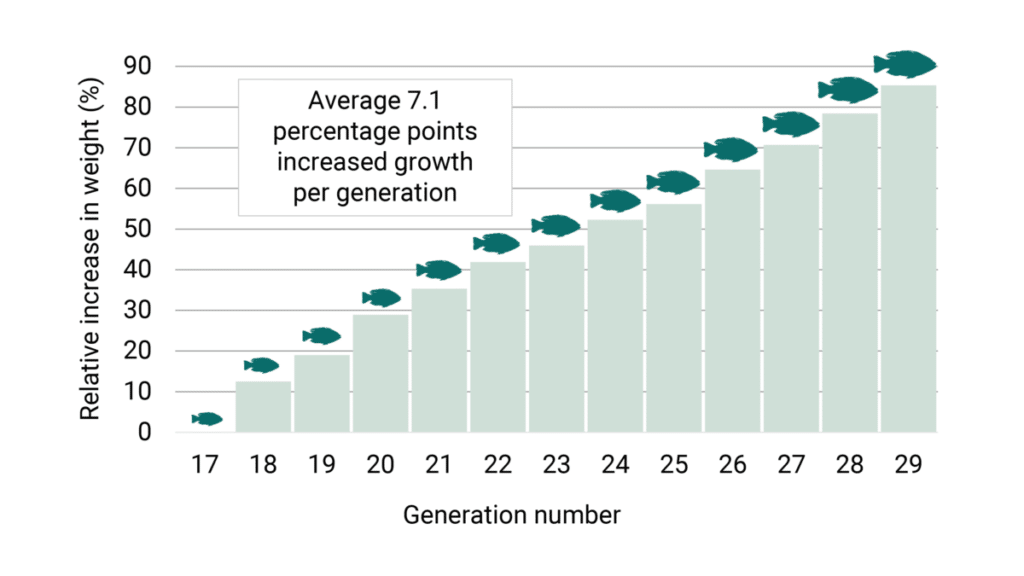
In the recent generations, the growth is still important and relevant, and has been weighted around 40-50 percent in the selections. Still the growth rate has been improved by an estimated average of 7.1 percentage points each generation (Figure 2).
Fillet yield
A more integrated and consolidated tilapia industry in various parts of the world required an increase in edible parts of tilapia. Hence, selection for fillet yield (ratio of fillet weight over whole-body weight) started from generation 17 and has been continued in the generations going forward. Both from a feed conversion perspective as well as for the profitability for the farming and processing industry, it is favorable to maximize the fillet yield. Fast growth will not automatically increase the fillet size, since the fillet proportions of the body vary from fish to fish.
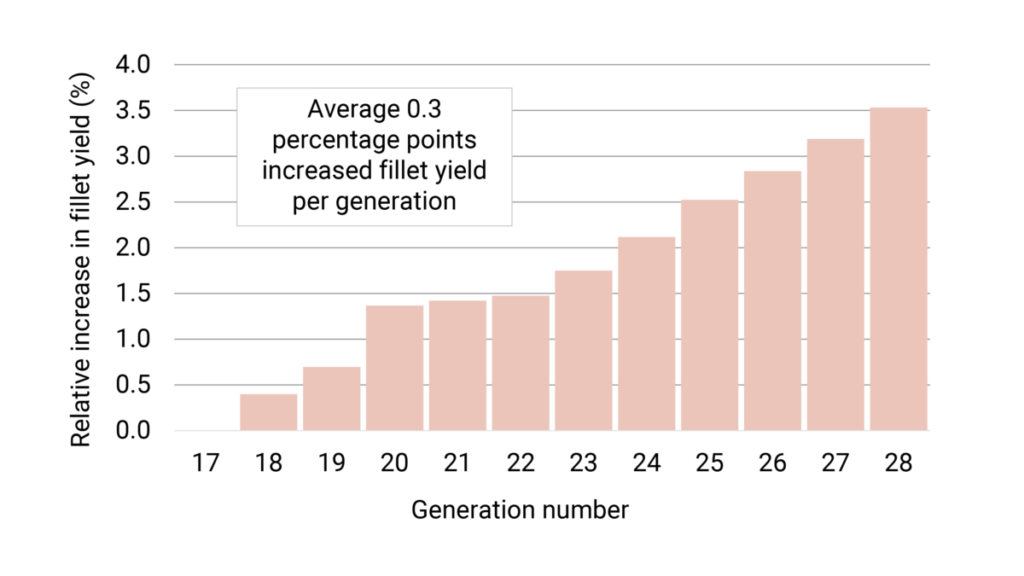
In these recent generations, the fillet yield has been weighted around 20-50 percent, resulting in an estimated average increased fillet yield of 0.3 percentage points each generation (Figure 3).
Resistance against streptococcosis
As the tilapia industry became more intensive, specific disease outbreaks became a major problem affecting the profitability of the industry. Hence, robustness and survival against specific diseases also became key traits for tilapia breeding. In the first phase general robustness was included in the breeding goal in 2010. Later, specific resistance against diseases, e.g., Streptococcus agalactiae, the major causative agent of streptococcosis, was implemented as a goal in the GenoMar breeding program in 2016.
Since then, for each generation, samples from all families in the GenoMar program are experimentally challenged with S. agalactiae to document genetic variance in resistance to the disease. These tests show clear and consistent variability in mortality between the families, ranging from 4 to 75 percent and this variability has formed the basis for the selection of families with better survival. In addition, our geneticists can determine the underlying genetic components associated with the differences in mortality, using a technology called genomic selection.
Tested in a field trial
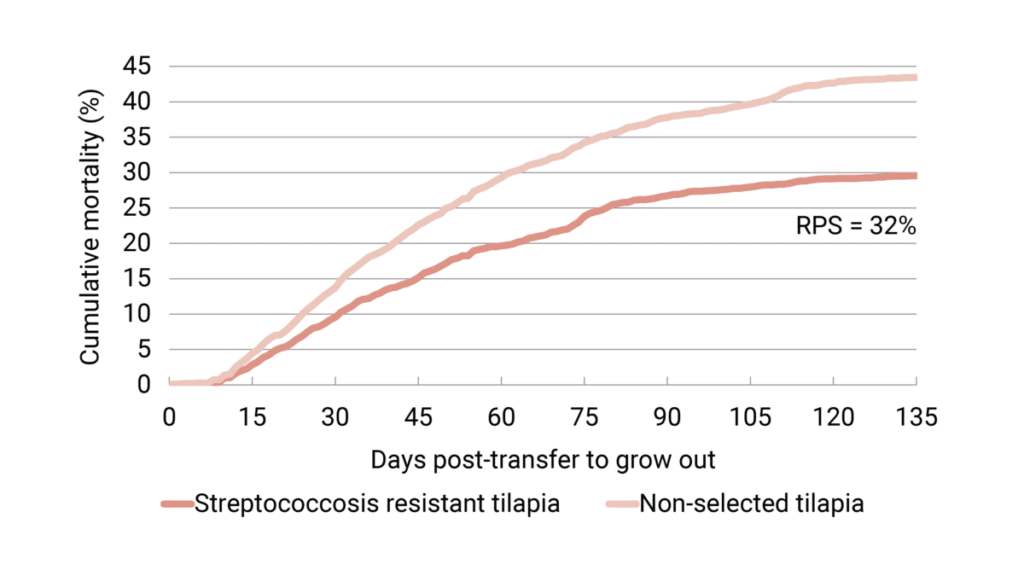
Natural infection under industrial field conditions is an important prerequisite to confirm the validity of protection found in laboratory tests. In 2020, tilapia selected for streptococcosis resistance and non-selected tilapia were placed together in cages in a commercial farm to test the different groups under industrial-scale conditions.
At 135 days post-transfer to grow out, the cumulative mortality was on average 29.6 percent for the selected fish and 43.4 percent for the non-selected fish. The dead fish showed clinical signs of streptococcosis. This result is in line with the laboratory tests and demonstrates that after three generations of selective breeding, survivability is increased throughout the entire grow-out phase by approximately 30 percent (Figure 4).
Differentiated products to the farmer
From the GenoMar brand we are offering two products, GenoMar GAIN and GenoMar STRONG that should meet different challenges in the farming environment.
GenoMar GAIN
A fast-growing tilapia (Oreochromis niloticus) genetically selected for high yield in farming. We have kept the solid underlying robustness and specific disease resistance improvements and continued the growth and fillet yield performance developed through many generations of systematic selections. Major weight is put on growth and minor weight on fillet yield.
GenoMar STRONG
A robust tilapia (Oreochromis niloticus) genetically selected for high survival in farming. We have kept the solid underlying growth and fillet yield performance and continued the robustness and specific disease resistance improvements developed through many generations of systematic selections. Major weight is put on streptococcosis resistance and minor weight on growth.
Read more about the benefits of the products here
Novel breeding technology incorporated
Breeding technologies can be defined as the science and technologies used to select the best performing individuals for a more profitable and sustainable tilapia industry. These technologies are used to rank the breeding stock population from best to worst. Based on this ranking, the best individuals are chosen to serve as the parents of the next generation. The accuracy of this ranking helps breeding companies to achieve higher genetic gain and to provide customised products to the market (Figure 5).
Over the last three decades, science has experienced various developments in breeding technologies to increase the accuracy of these rankings. The methods are described in detail below.
Traditional selection methods
Mass selection using observed physical traits
One of the earliest selection methods, mass selection is still prevalent in small-scale tilapia industries. The fish are ranked based on the observed physical traits (phenotypes). It is often called selection on own performance and is an easy, simple and cheap way to select the broodstock. You do not need any advanced technical knowledge for using this method.
The success of mass selection depends on the contribution of genetics to the phenotype. It has been widely shown that phenotype is the function of genes, environment and the interaction between these two. For the growth trait, the contribution of the genes to the phenotypic variance (called heritability) is on average around 30 percent. This implies that the mass-selected broodstocks do not provide the better ranking of genetically best broodstock in the population. Further, fish cannot be selected for the phenotypes which are measured in dead fish (e.g., fillet yield) by this method.
Family-based selection using information from family members
The next, more advanced, method of selection is using information from family members of the fish (family-based selection). Statistical models are used to dissect the genetic merit of breeding candidates and ranking them. Best Linear Unbiased Prediction (BLUP) has been the golden statistical model for determining the genetic merit of an individual until recently. The method was developed and perfected during the 1940s to 1970s in parallel with improvements in computing power.
BLUP provides for very accurate estimates of genetic values, thereby giving accurate ranking of the fish because it accounts for non-genetic differences between individuals such as a pond, temperature or hatching day as well as incorporating performance information from all relatives (parents, grandparents, offspring) in the pedigree. GenoMar was a pioneer in the application of BLUP methodologies in the breeding program of Nile tilapia.
Marker-assisted selection using DNA-information

One important prerequisite for using family-based selection is to give an accurate ranking of the broodstock without errors in the family relationships. Thus, to produce accuracy, GenoMar started to use the DNA-information (microsatellite markers) to identify the parents and other family members in the tilapia breeding program from 2000. GenoMar has therefore been using marker-assisted selection to construct pedigree and BLUP model for a very long time. Not only for growth-related traits, but also other traits like fillet yield, robustness, resistance to different economically important bacterial diseases, etc. consecutively as shown in Figure 1.
Genomic selection using comprehensive DNA-information

During the 2000s a paradigm shift took place in animal breeding with the arrival of genomic selection or genomic prediction methods. Professor Theo Meuwissen and co-workers introduced the concept in 2001. Gradually, this method has been implemented in the livestock industry during the past decades.
The first genotyping tool for tilapia
GenoMar developed the first commercial tilapia genotyping tool, also referred to as a SNP (single nucleotide polymorphism)-panel in 2016. A SNP is a specific place in the genome that vary with different base pairs (Cytosine-Guanine and Adenine-Thymine) from fish to fish. The chosen SNP’s with a defined base pair is linked to traits of importance in breeding.
We revealed more than 2 million places in the tilapia genome where fish differ from each other at a single nucleotide. Around 60 000 of those SNPs were selected to construct the first SNP-panel to be used commercially in tilapia breeding (Figure 6).
Today 100 percent of the candidate fish in our breeding programs are genotyped and selected based on genomic breeding values. Thereby, the number of genotyped fish is increasing every year.
What are the advantages of DNA-information?
DNA-information (genotypes) is used to improve the quality of the breeding decisions in tilapia family breeding programs by:
1) More accurate prediction of breeding values for traits that are not possible to measure on candidate fish
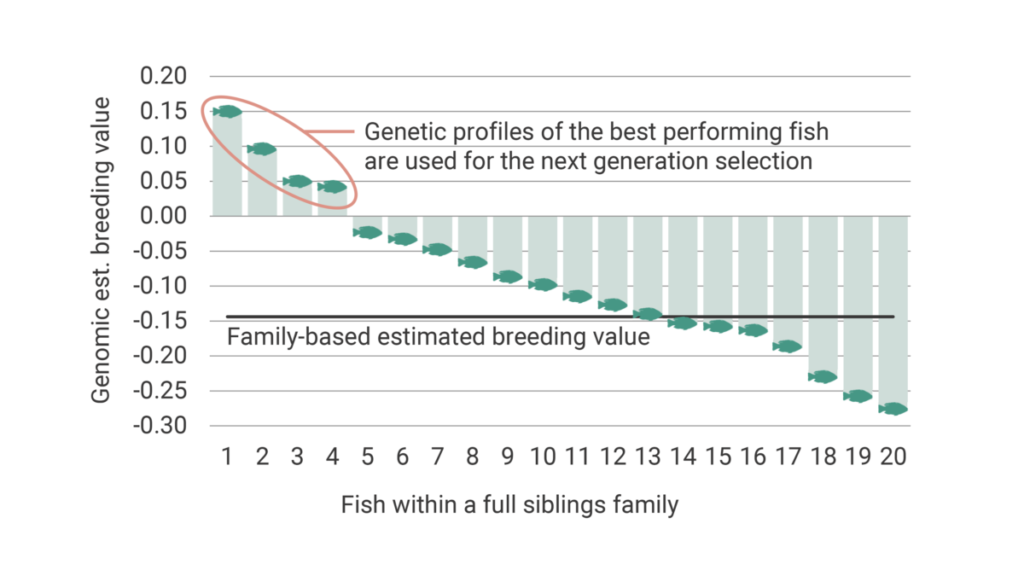
Measuring traits such as fillet yield or resistance to specific diseases cannot be done on selection candidates because it requires either the sacrifice of the fish or exposure to standardized pathogen challenge tests. This makes it impossible to use those fish as candidates for the next generation. Until recently, selection for such traits depended on the measurement of the traits in a group of siblings and the determination of the best families. By this, we could only rank the families from best to worst and were unable to rank the fish within the families for such traits. Genomic selection provides, however, the opportunity to select the best fish within each family. This increases the accuracy to list the fish from best to worst for selection decisions, as shown in Figure 7.
This has been possible by providing the actual relationship between individuals. A more accurate relationship between individuals provides a precise ranking of the breeding candidates. Using family information, the relationship between half-siblings (sharing one common parent) is 0.25. Full siblings (sharing both parents) is 0.5 and unrelated individuals (no common parents) is 0. Genomics, on the other hand, helps us to determine the actual proportion of the shared genome between the individuals (e.g., some full siblings might be more related than others).
2) Understanding the genetic architecture of traits
Different traits have varying characteristics. Some of the traits are controlled by only one gene, whereas others are controlled by multiple genes located in various parts of several chromosomes. DNA-information together with the available genomic resources helps to understand the architecture of the traits and find the causative gene and mutations responsible for the variation in a trait. For example, the gene Amhy (Y-specific duplicate of the anti-Müllerian hormone) has been identified to be responsible for the male sex determination and the SNP/mutation of the gene in the population. This gene helps us to identify the sex of the tilapia fish, as early as possible, before sexual maturity.
Read more about our achievements during 30 years of tilapia breeding, published in two articles in AQUA Culture Asia Pacific here: